A full version of LinkWare Stats is included in LinkWare PC..
Testing todays advanced cabling plants is so complex that a single Category 5e test report includes more than 400 data fields. Com trabalhos comuns incluindo desde centenas a milhares de links, mesmo se você filtrar todos os resultados e ver que todos eles podem ser aprovados, ainda restam questões críticas.
-
Como você pode dizer com facilidade se uma especificação de teste incorreto foi utilizada?
-
Which adapter was used?
-
Todos os verificadores foram usados com o software correto?
-
Você obteve as margens esperadas?
-
Eram consistentes?
Fluke Networks has the answer with LinkWare Stats, a results analysis software option that integrates with our LinkWare Cable Test Management Software. LinkWare Stats generates statistics on the cabling links within your LinkWare database then transforms the performance results into summary graphics that give you the analytical information you need, fast.
Whether youre a network owner, cabling contractor or manufacturer, now for the first time, you can quickly see the true performance of the entire cabling plant and spot any anomalies or inconsistencies.
An example of a LinkWare Stats report is available by clicking here (PDF 201 KB)
LinkWare has the flexibility to let you breakdown the results to floor level, as defined in ANSI/TIA/EIA-606-A. An example of a project broken down to building level is available by clicking here (4,6 MB) You will need Microsoft Internet Explorer 5,0 or higher to view the report.
LinkWare Stats works hand in hand with LinkWare cable test results management software. LinkWare gives you the power to manage results data from multiple testers with one single software application. LinkWare Stats gives you the statistical analysis and reporting power to move above and beyond page-per-link reports. It analyzes and transforms LinkWare cable test data into graphics that reveal your cabling plant performance summarizing your entire cabling infrastructure in a compact, graphical format that makes it easy to verify margins and spot anomalies.
-
Get a complete view of cabling plant performance in ways you havent seen before
-
Filter incoming data to highlight exactly what youre looking for
-
View graphs and tables that show margins by test standard, operator, location and other attributes
-
Eliminate the chance that an anomaly gets overlooked; graphs highlight marginal or failed links in color
-
Quickly and easily demonstrate that the installation meets warranty requirements
-
Win more business with professional and customized performance summary reports
LinkWare Stats gives you an instant overview of your installed cabling plants performance, with plenty of detail if you want it. Você contava com 3 dB de altura livre sobre a linha de limite? In a simple picture, LinkWare Stats tells you if its there.
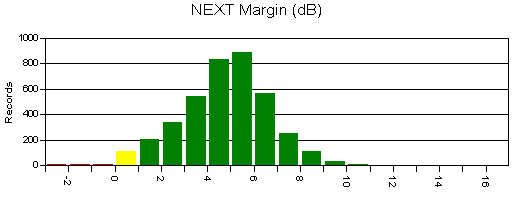
Todas as ferramentas foram usadas no trabalho que executou o teste correto?
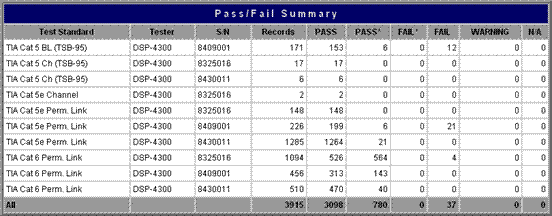
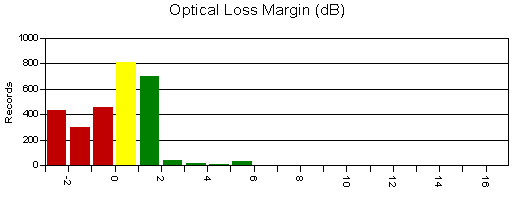
Você pode ver olhando rapidamente. Want to know the margins for you Optical Fiber Test Results? Its all there for every measurement, floor, building, and test type.
O LinkWare Stats torna fácil para os contratantes de cabeamento demonstrarem um nível de profissionalismo e de atenção à qualidade que os destaca em uma indústria competitiva. Ele fornece uma folha de rosto personalizada e um resumo gráfico do trabalho completo de instalação para demonstrar a qualidade de seu trabalho ao seu cliente. Já participou de um grande trabalho, só para descobrir depois de uma semana de testes que alguém usava o padrão ou adaptador errado para o teste? With LinkWare Stats, a quick review of the first days results immediately lets you know if youre on track as expected.
Já se perguntou quais componentes têm realmente um melhor desempenho após a instalação? Its obvious with LinkWare Stats. Quer ter a certeza de que o fabricante emitirá a cobertura da garantia rapidamente? LinkWare Stats presents test results the way manufacturers prefer to see them.
LinkWare Stats makes warranty review of installed results a breeze and provides useful data for future designs. At a glance, you can see which pairs had the worst results and at what frequencies they occurred.
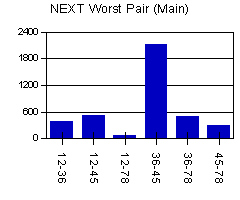 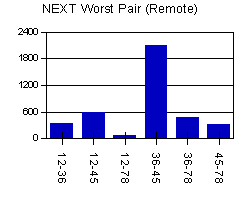
LinkWare Stats also allows analysis over a large population of installed products, so you can review performance by contractor. Whos doing the best terminations? If the average NEXT margins are 5 dB, why is one cluster of results only 2 dB? Are your near and far-end results consistent?
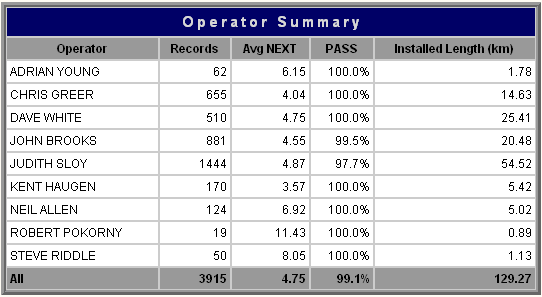
Tired of thumbing through binders of printed test results? Analyze 500 links in minutes with LinkWare Stats. Preview the results before compiling a report.
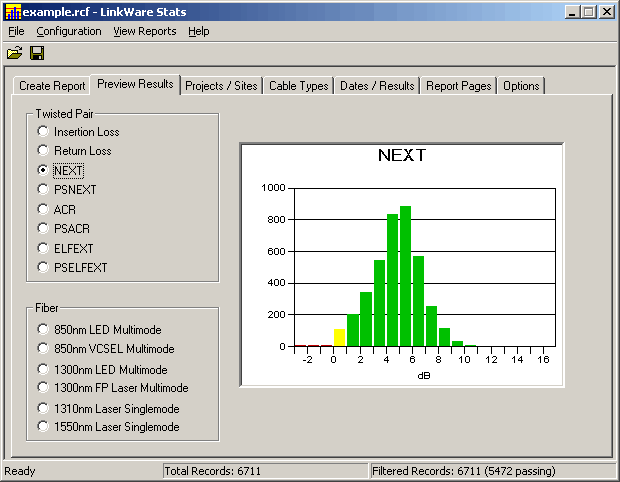
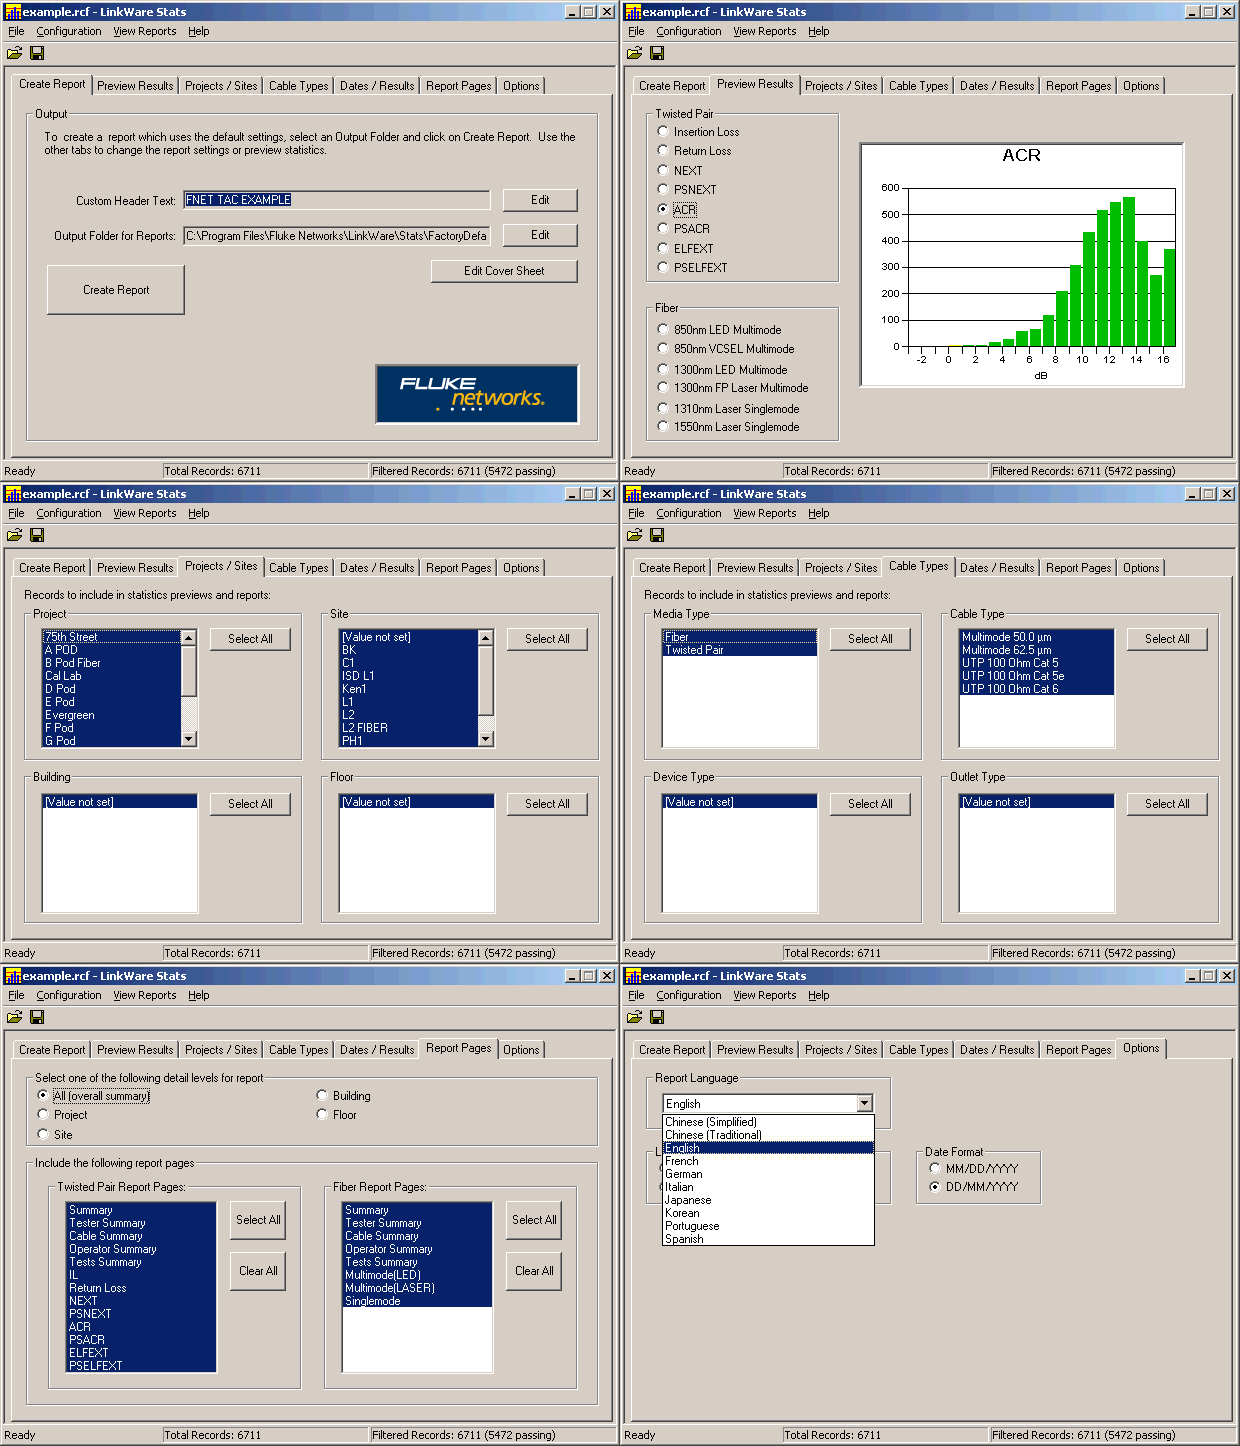
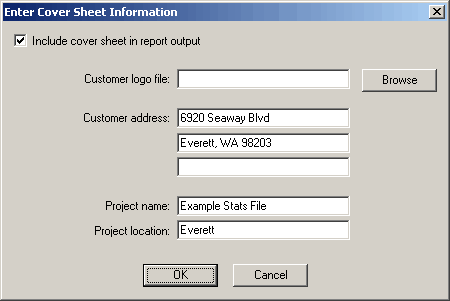
Start with the default setup, add a cover page with your company logo, select the report page types, and preview a sample. One setup is all it takes to save the configuration so you can produce it again easily.
|


