The standard ANSI/TIA-568-C.2 along with ANSI/TIA-1151 and ISO/IEC 11801 along with IEC 61935-1 clearly specify what has to be measured and how.
For TIA Category 5e, 6, 6A and ISO Class D, E, EA F, FA, the following must be measured:
- Malha elétrica
- Length (1)
- Retardo de propag.
- Desvio do retardo
- Perda de inserção (atenuação)
- PRÓXIMO
- PS NEXT
- Perda de retorno
- ACR-F (ELFEXT)
- PS ACR-F (PS ELFEXT)
- DC Loop Resistance (2)
- ACR-N (2)
- PS ACR-N (2)
1) Length is not required for compliance to IS0/IEC 11801. It is however measured and reported.
2) Not required for TIA Standards. However, the DTX provides this data for Category 5e, 6 and 6A Autotests.
Intervalo da frequência
- Category 3: 1 MHz to 16 MHz.
- Category 5e: 1 MHz to 100 MHz.
- Category 6: 1 MHz to 250 MHz.
- Category 6A: 1 MHz to 500 MHz.
- Class C: 1 MHz to 16 MHz.
- Class D: 1 MHz to 100 MHz.
- Class E: 1 MHz to 250 MHz.
- Class EA: 1 MHz to 500 MHz.
- Class F: 1 MHz to 600 MHz.
- Class FA: 1 MHz to 600 MHz.
- 10GBASE-T measurements made from 1 MHz to 500 MHz.
Frequency Resolution

Obs.:
- From 1 to 31,25 MHz, the DTX CableAnalyzer measures in 125 kHz steps, more (better) than the minimum required in ANSI/TIA-1152 and IEC 61935-1. That's why you see "Actual DTX Measurements" as 243.
- The ANSI/TIA-1152 standard only specifies testing to 500 MHz.
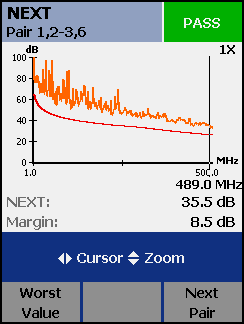
Any DTX owner can verify the information provided in the table above. To do this, run an autotest and view the NEXT plot. Pressing the  key on the DTX will move the cursor marker on the trace across one point. An example is shown below. key on the DTX will move the cursor marker on the trace across one point. An example is shown below.

This screen shot was taken from a DTX-1800 CableAnalyzer set to the TIA Category 6A standard.
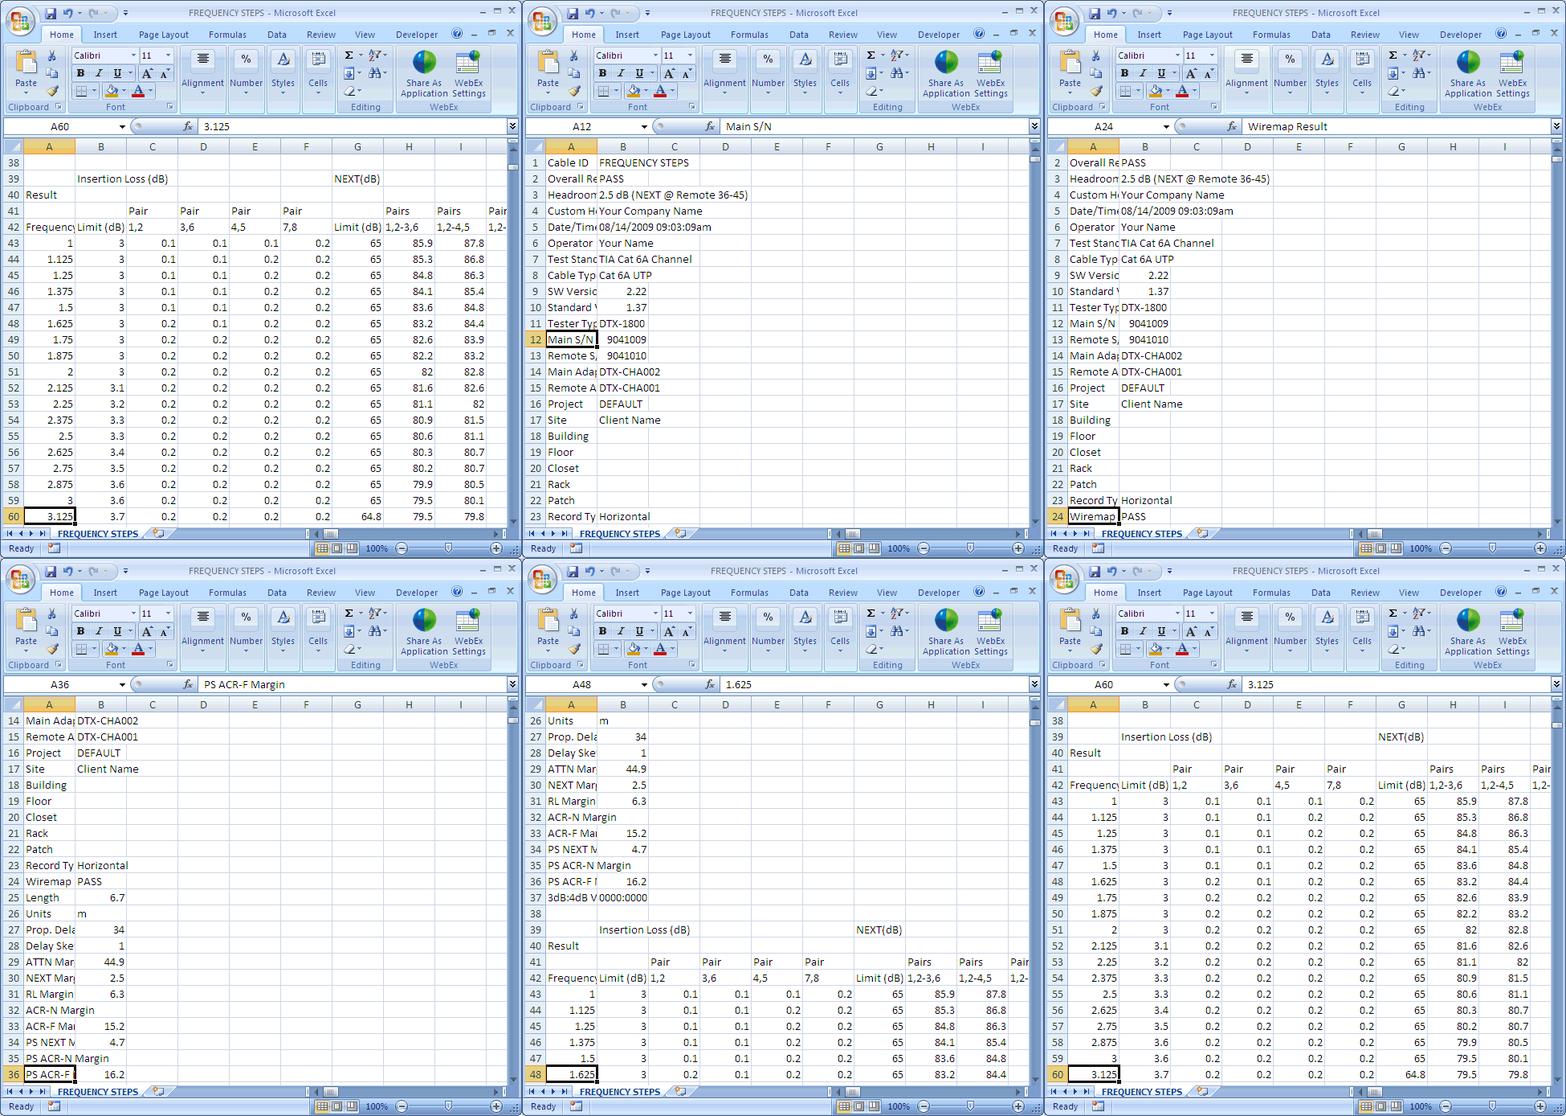
Below is a CSV output file from a Category 6A Autotest. Opened in Excel, you would see:-

You can also do this yourself by downloading LinkWare PC, opening the sample.flw file, viewing the plot and saving it as a CSV file.
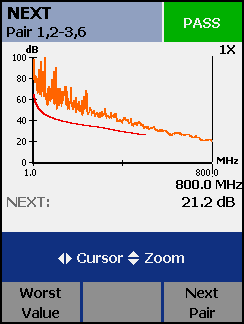
Owners of the DTX-1800 CableAnalyzer have the ability to measure to 800 MHz and 900 MHz for Insertion Loss, ACR-F and PS ACR-F. Just go to SETUP > Instrument Settings > Store Plot Data and selected Extended. The frequency resolution remains at 1 MHz after 500 MHz. An example is shown below.

|


